Chaining
The weights for an index ideally give a measure of the economic importance of the goods that comprise the index, so that price relatives for goods and services with greater economic importance have a larger influence on the overall price movement between periods. In application the weights are often reused over time, as it is costly and time consuming to continuously update the weights. Keeping the same weights period after period, however, means that the weights will eventually become out of date, and may fail to capture changes in the economic importance of certain goods. Chaining an index provides a way to update the weights for an index and append new index values to the index series calculated with the old weights, without having to revise the old index series. Chaining can also be used to change the composition of goods and services covered by a price index, and this can change as new goods are introduced into a market and old goods disappear.
The idea behind chaining is the same as that for factoring an index—break an index into two pieces that can be glued together at a common overlap period. The difference is that while factoring an index is simply a trick of algebra, chaining an index is a practical solution for producing an index with a longer time series, rather than restarting the index in the period when the weights change. In both cases the idea is to modify the value in the base period of an index to reflect the cumulative change in price up to that point in time.
The steps for chaining any kind of index are the same, so consider an arithmetic index running from period 0 to period \(t\), and suppose the weights for this index change in some period \(k\). This could be because the previous weights have become sufficiently out-of-date that they need to change, or goods and services for which the index applies have changed. Whatever the reason, this gives rise to two indices, one running from period 0 to period \(k\), using period-0 weights \[\begin{align*} I^{A}(0, k) = \sum_{i = 1}^{n} \omega_{i0} \frac{p_{ik}}{p_{i0}}, \end{align*}\] and another running from period \(k\) to period \(t\) using period-\(k\) weights \[\begin{align*} I^{A}(k, t) = \sum_{i = 1}^{m} \omega_{ik} \frac{p_{it}}{p_{ik}}. \end{align*}\] The chained index simply multiplies these two indices together, so that \[\begin{align*} I^{A}(0, t) = \sum_{i = 1}^{n} \omega_{i0} \frac{p_{ik}}{p_{i0}} \times \sum_{i = 1}^{m} \omega_{ik} \frac{p_{it}}{p_{ik}}. \end{align*}\] The chart below gives an example of what a chained index looks like.
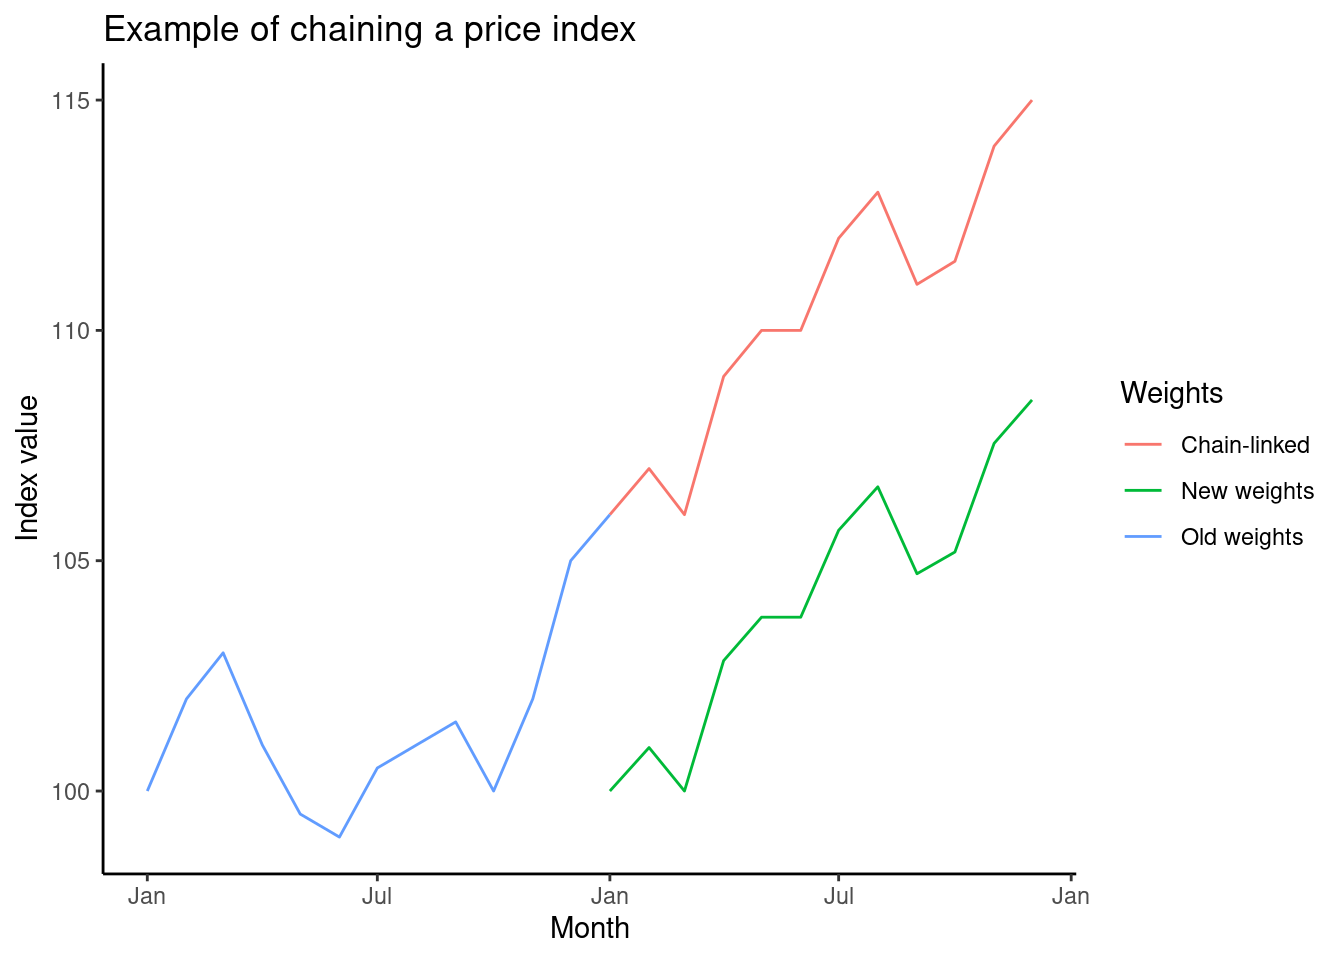
The important part about a chained index is the overlap period \(k\) when the weights change, and the prices in period \(k\) get used with two sets of weights. If there is no overlap period then the index cannot be chained. Each index can be thought of as a link in the chain, giving the movement in prices for that section of time, and the overlap period is where the links meet.